
Data Literacy for Non-Technical Leaders: Making Smarter Decisions
In June 2026, business leaders are drowning in data yet often starving for real insight. Dashboards flash metrics, AI tools spit out predictions, and reports pile up—but without the ability to interpret them critically, ask probing questions, and apply them ethically, these become noise rather than advantage.
Data literacy bridges that gap. For non-technical managers and executives, it’s not about coding or building models—it’s the ability to read, understand, question, communicate, and act on data to drive better strategy, performance, and outcomes. In 2026, with AI accelerating data volume and complexity, data-literate leaders outperform: they spot trends faster, reduce risky “gut” decisions, foster trust in analytics, and guide teams toward evidence-based growth.
Studies show organizations with strong data literacy see twice the transformational outcomes in decision quality, innovation, and customer experience. Yet gaps persist—only about 36% of organizations have mature programs, and many executives feel underconfident despite high stakes. This article equips you with practical ways to build data literacy: interpreting insights, asking the right questions, and using analytics responsibly—no PhD required.
Why Data Literacy Is Essential for Leaders in 2026
Data is everywhere: customer behavior, operational efficiency, market signals, AI-generated forecasts. Leaders who ignore it risk decisions based on incomplete pictures or outdated assumptions. Those who embrace it gain edge—faster pivots, better resource allocation, and competitive advantage.
Key 2026 realities:
- AI and big data amplify volume and speed, but human judgment remains crucial for context, ethics, and strategy.
- Perception gaps exist: Many executives overestimate team proficiency while employees lack confidence.
- Data-driven organizations achieve higher productivity, profits, and revenue goals.
- Ethical lapses (bias, privacy breaches) carry massive reputational and financial risk.
Data literacy empowers non-technical leaders to bridge analytics teams and business needs, turning raw numbers into actionable strategy.
Core Elements of Data Literacy for Non-Technical Leaders
Focus on these foundational pillars—no coding needed:
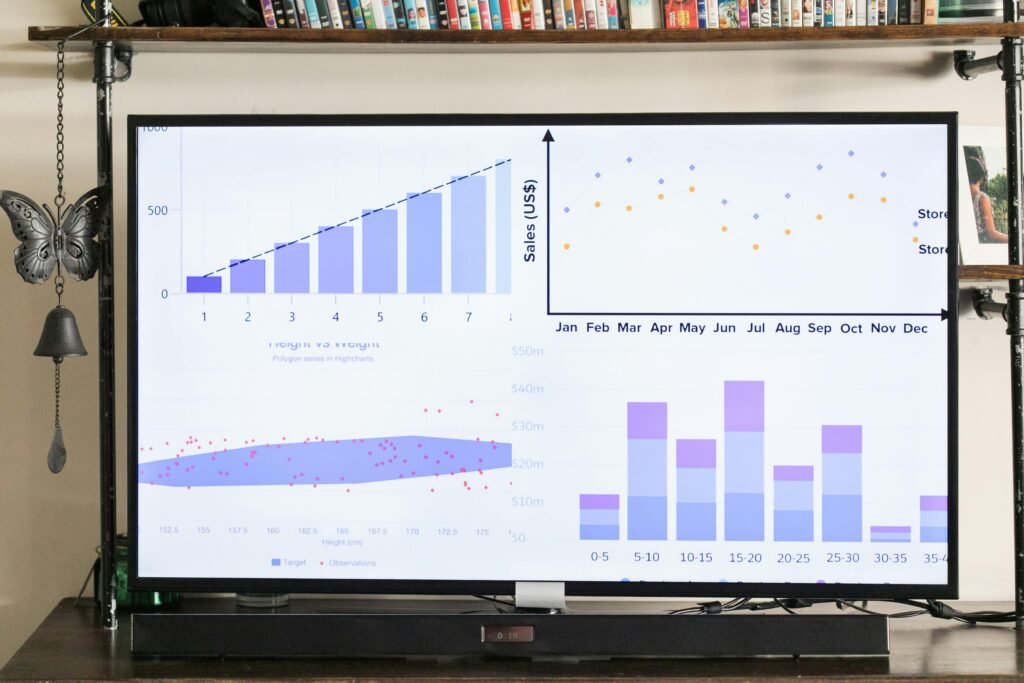
- Reading and Understanding Data Grasp basics: What do charts show? (e.g., trends, correlations vs. causation). Recognize common visuals (bar graphs for comparisons, line charts for time series, scatter plots for relationships). Understand key stats: averages, medians (when outliers skew), percentages, growth rates.
- Critical Thinking and Asking the Right Questions Challenge assumptions. Key questions include:
- What problem are we solving? Does this data address it?
- What’s the source? How was it collected? Any biases or sampling issues?
- What’s missing? (e.g., context, external factors)
- Is this correlation or causation?
- How reliable is the sample size or confidence level?
- What alternative explanations exist?
Leaders with “data intuition” pause when numbers feel off and probe deeper.
- Interpreting Insights in Business Context Connect data to your domain: How does a dip in engagement metrics link to strategy? Use domain knowledge to weigh relevance—e.g., seasonal effects or market shifts.
- Communicating Data Effectively Turn insights into stories: Use clear narratives, avoid jargon, tailor to audiences (executives want impact, teams want action steps). Practice data storytelling for buy-in.
Practical Techniques to Interpret Data Insights and Ask Better Questions
Build habits daily:
- Start Simple: Review one dashboard weekly. Ask: “What story does this tell? What surprised me? What follow-up data do I need?”
- Use Natural Language Tools: Leverage AI like ChatGPT or business intelligence platforms with natural query (e.g., “Show revenue by region last quarter vs. forecast”).
- A/B Test Mindset: When seeing results, always consider: “Compared to what?” Benchmark against goals, history, or peers.
- Spot Red Flags: Watch for cherry-picking, misleading scales, or over-reliance on averages.
- Scenario Thinking: Ask “What if?”—e.g., “If this trend continues, what’s the business impact?”
These build confidence without technical depth.
Using Analytics Ethically to Guide Strategy and Performance
Ethics isn’t optional—it’s foundational for trust and sustainability. In 2026, with regulations tightening and public scrutiny high, ethical data use protects reputation and enables long-term success.
Core principles for leaders:
- Transparency and Consent Always clarify data usage. Ask permission where possible; be explicit about collection and purpose.
- Privacy and Respect Prioritize data minimization—collect only what’s needed. Protect sensitive info rigorously.
- Bias Awareness and Fairness Question sources for inherent biases (e.g., historical data reflecting past inequalities). Ensure diverse inputs; audit AI outputs for fairness.
- Alignment with Values Ensure analytics serve positive outcomes. Avoid manipulative uses; weigh long-term impacts on stakeholders.
- Accountability Own decisions—don’t hide behind “the algorithm said so.” Document reasoning and be ready to explain ethically.
Leaders who embed these build cultures of trust, where data drives innovation without eroding confidence.
Building Your Data Literacy: Next Steps for 2026
Start small: Dedicate time weekly to reviewing data with curiosity. Involve your team—share insights, encourage questions. Foster organization-wide literacy through training and clear metric definitions.